Premium Bubble Chart
$59.00

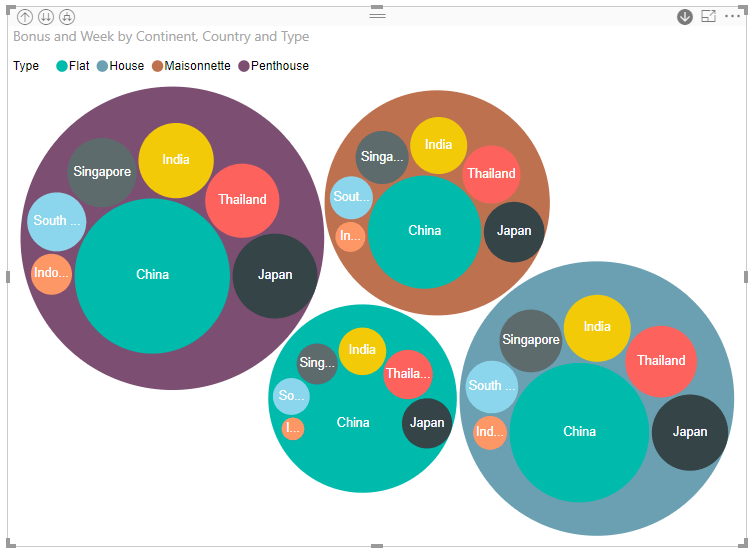
Drill Mode Support
One of the most user-requested features for this visual, the Drill Down feature is a valuable tool for users who have a hierarchical category structure.
With this feature turned on, users can assign their bubbles to a hierarchy of categories and drill down or up to view every level in the visual.
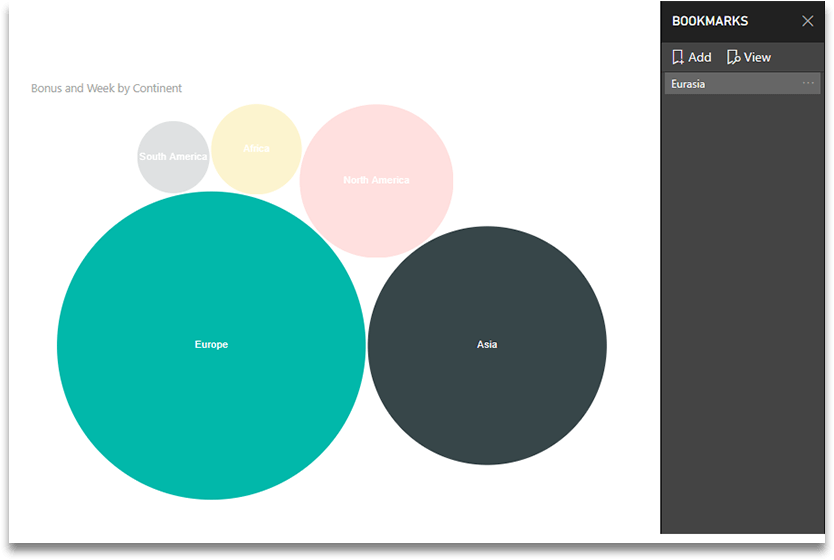
Bookmarks Support
When users create new bookmarks, the Bubble Chart’s selection, filter, and Drill Mode status will be saved.
This way, users can easily restore all these settings by applying the bookmark later.
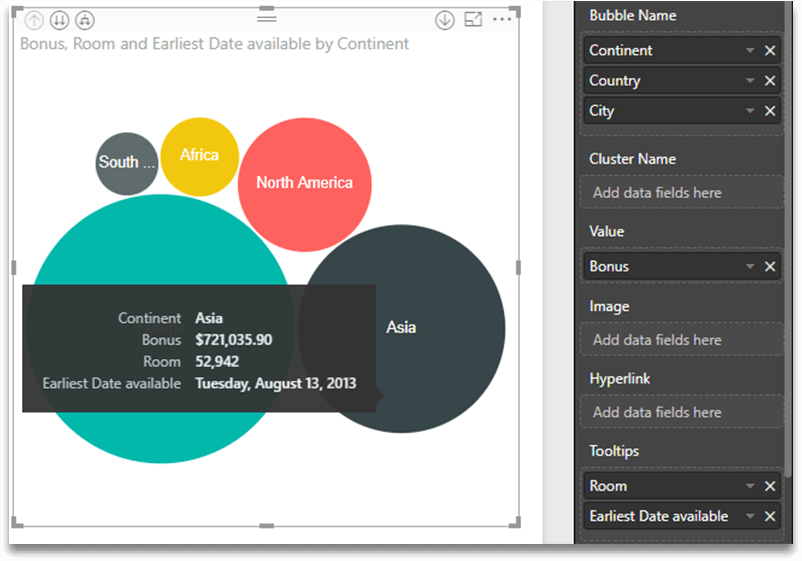
Tooltips Field Bucket
With this feature, users can customize the data which is shown in Tooltips when they hover over each bubble.
By dropping one or more fields from the dataset into the Tooltips field, the visual will show the corresponding values for each field in the Tooltip when users hover over each bubble.
All values in the Tooltip will be formatted accordingly to your data model settings.
How to activate your annual subscription:
- Purchase a premium key using the “PayPal” button above. This subscription will last for one calendar year and then must be renewed by you to continue using the visual. This premium key will add premium features to your regular Bubble Chart visual account. We accept credit card, debit card, and PayPal payments.
- Add “Bubble Chart by Akvelon visual” custom visual to your Power BI report in Power BI Desktop or Power BI Service (app.powerbi.com)
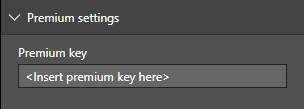
- Open the Format pane of Bubble chart visual and apply your premium key by setting Premium Settings -> Premium Key parameter.
Your Premium key is not limited by the number of Power BI reports you create or the number of Power BI users who use these reports.