Description
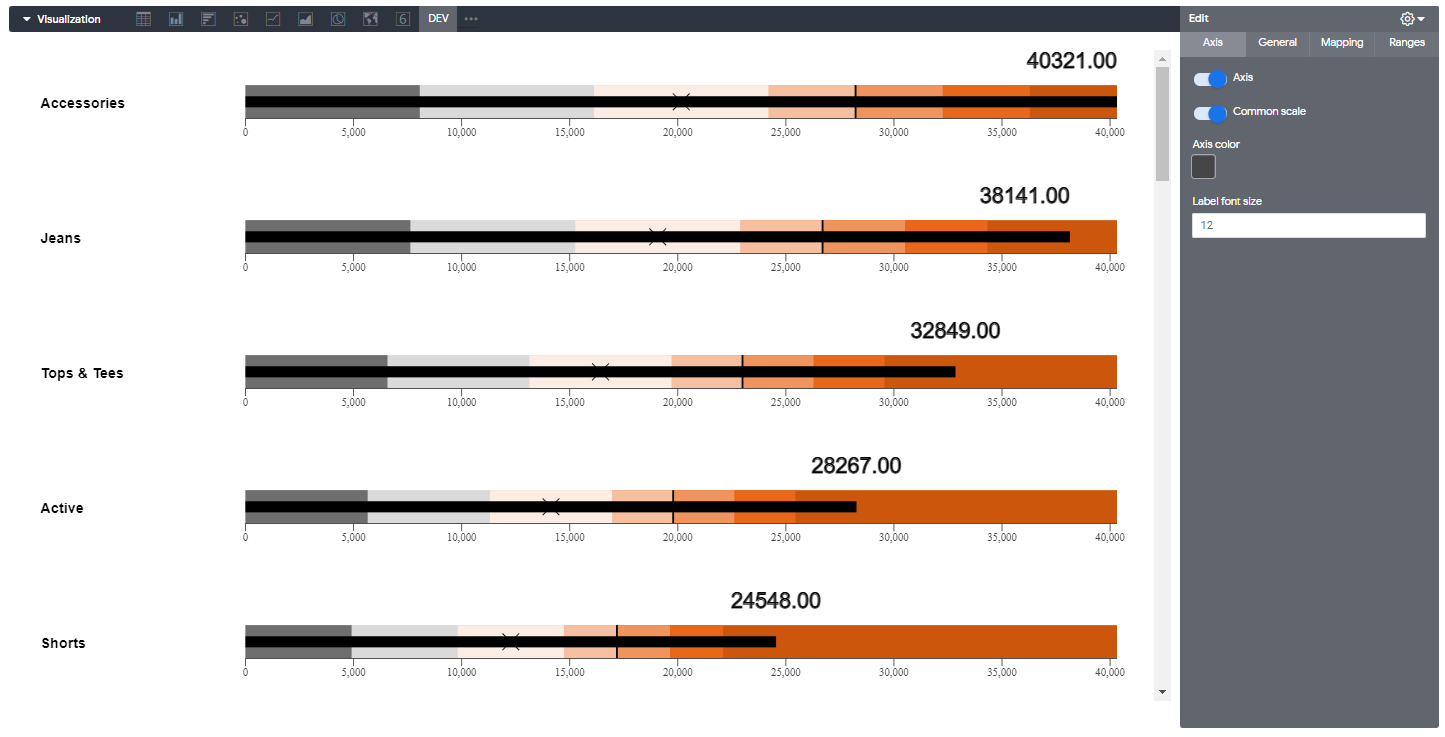
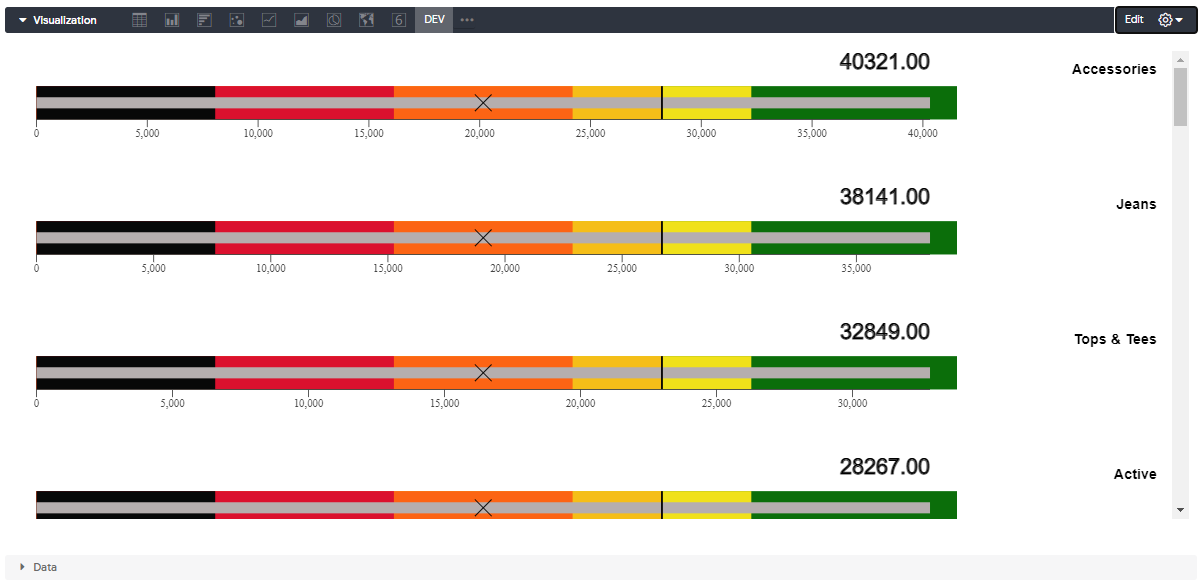
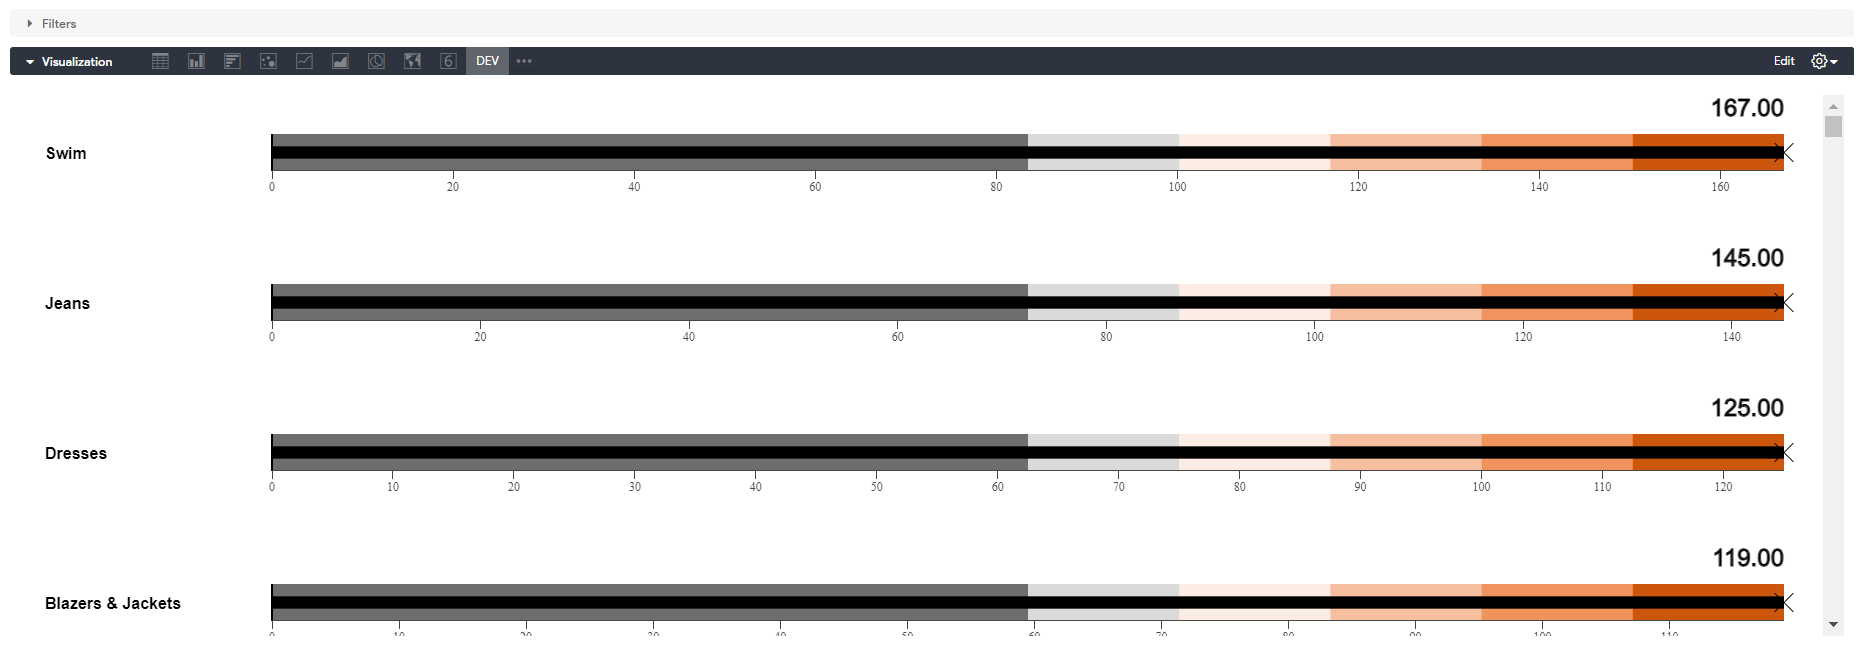
The bulleted chart contains one main indicator (for example, income for the current year), compares this indicator with one or more other indicators in order to expand its value (for example, in comparison with the target indicator), and displays it in the context of qualitative ranges of indicators, such as bad, satisfactory and good. Quality ranges are displayed as different intensities of the same shade to make them distinguishable for colorblind people and to minimize the use of colors on the dashboard.
Visual capabilities
Chart supports customization. Users can configure the color of bar indicator, range values and colors, category title text, color, font family, and font size.