PlotlyJS
Plotly.js visual by Akvelon
combines Plotly.js, react-chart-editor and Power BI.
Description
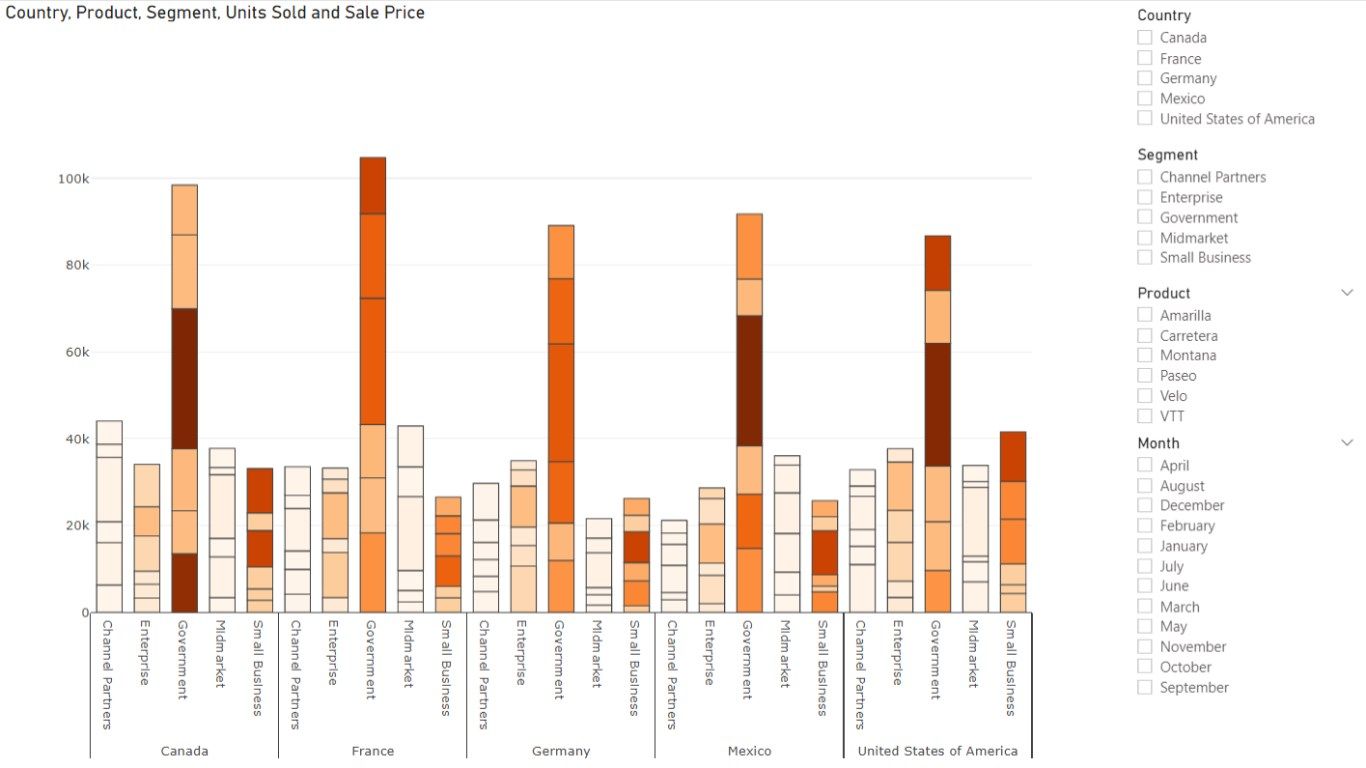
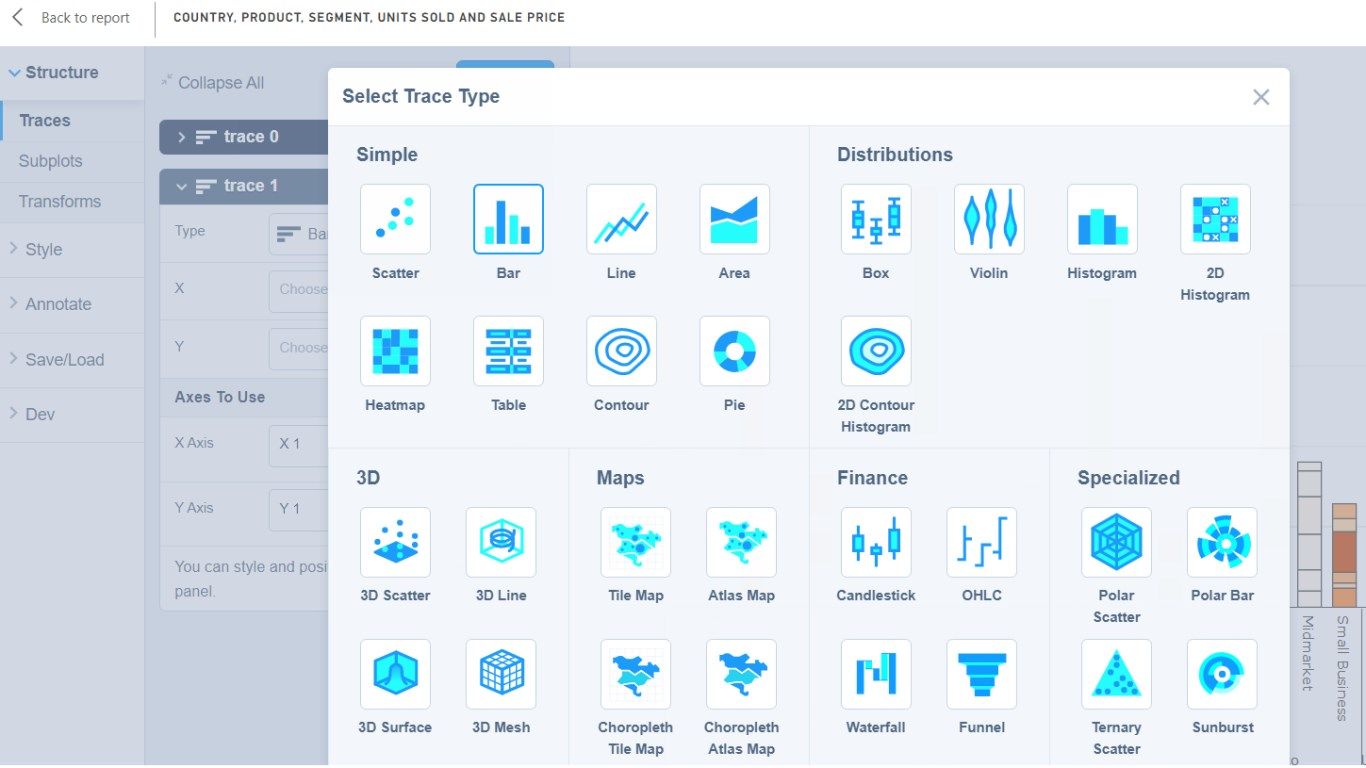
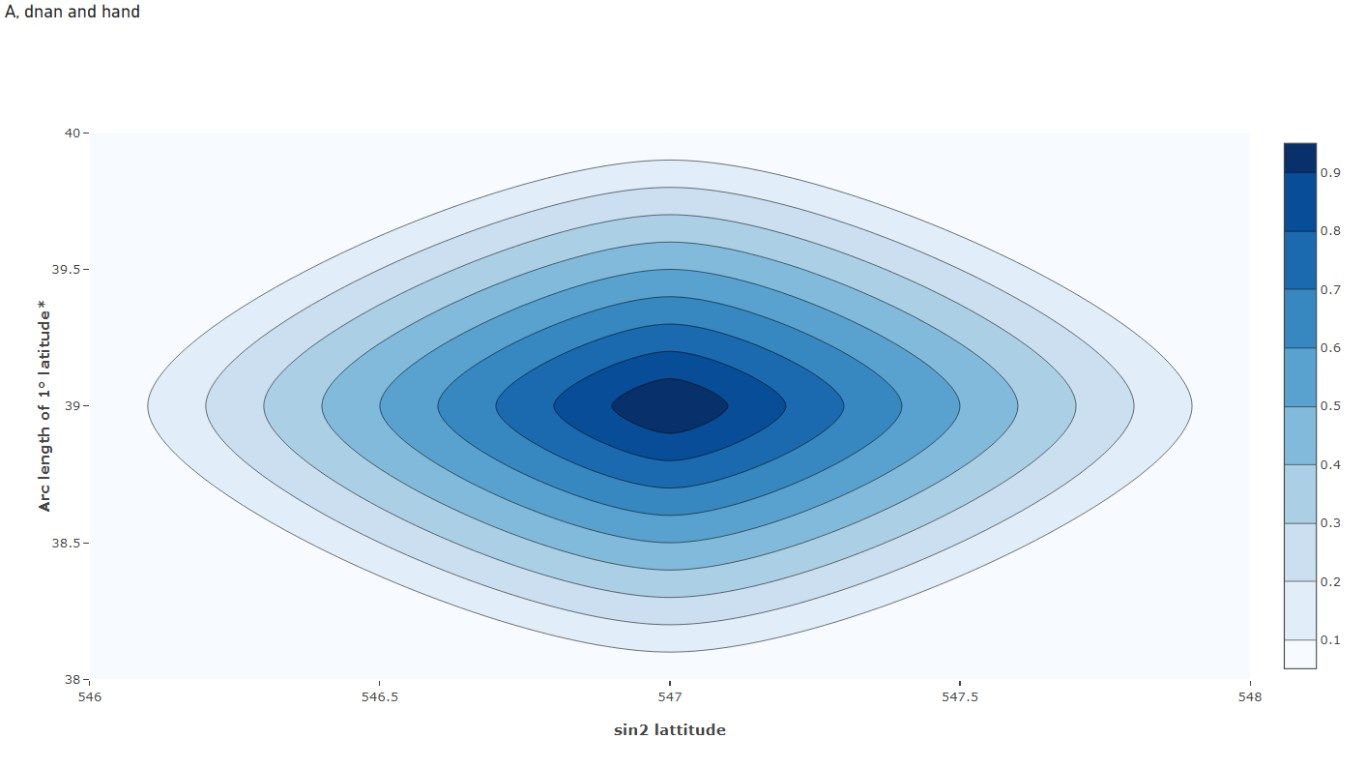
Our newest visual combines Plotly.js, react-chart-editor, and Power BI to allow users to present their data using the capabilities of Plotly.js. It also provides a chart editor that helps users to create and customize over 40 types of charts in Power BI.
Visual capabilities
When this visual is used, it can access external services or resources